Why Did We Create This Index?
We created the Staying Even Index to provide better information to individuals about how they are doing and whether they are truly getting ahead financially. At a time when many are worried about increasing income inequality, we have been missing a simple way for individuals to know how much income growth they need to stay even. Importantly, the Consumer Price Index is not the answer and significantly underestimates what is necessary to keep up (more below on this). The Staying Even Index fills the gap.
How is the Index Calculated?
The Index is based upon the simple proposition that for individuals to maintain their relative economic place in society – to at least "Stay Even" over time – their incomes must grow at least as much as the average income in society. We use GDP per capita as a proxy for average income.
The Index is calculated using U.S. government data on total economic activity and population. US Department of Commerce data is used for GDP and Federal Reserve monthly population estimates are used for population (see more in Raw Data tab). 1952 is utilized as the base year, in which the Index is set to 100. Gross Domestic Product (GDP) per capita is calculated for the base year and each successive year and the Index is accordingly increased consistent with GDP per capita growth.
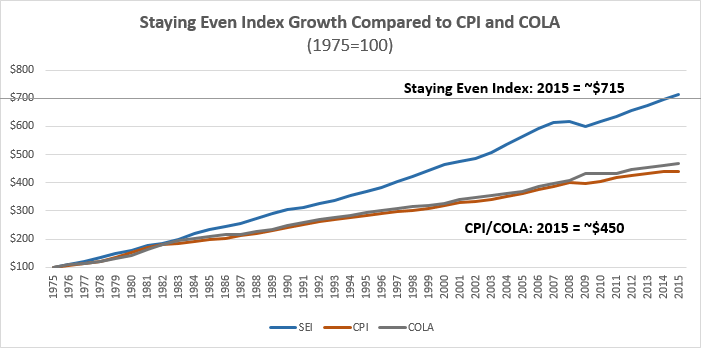
How Does the Staying Even Index Compare to the Consumer Price Index (CPI) and Cost of Living Adjustments (COLA)?
The Consumer Price Index is published by the United States Department of Labor. There are several different indices, the most commonly referenced is the CPI-U, the consumer price index for all urban consumers, which the DOL states represent about 87% of the U.S. population. The CPI tries to measure the average change in price paid for a normal set of goods and services, not the growth in average incomes. For more on the CPI, read here.
Cost Of Living Adjustments, or COLAs, are calculated by the Social Security Administration and used to adjust Social Security payments to those on the program. They are based upon one of the Consumer Price Indices and as such track closely the CPI. For more on Social Security Administration COLA, read here.
Both CPI and COLA significantly understate what wage growth is necessary to Stay Even. While both metrics track price changes over time, they do not reflect growing overall wealth in the economy and the fact that average person is able to buy more over time. This effect is relatively small in any one year but grows very large over time. For example, a person who in 1975 was earning $100 and had their income increase every year by the same amount as CPI/COLA would have earned about $450 in 2015. If that same person's income had increased in line with the Staying Even Index, they would have instead earned over $715 in 2015. In other words, Staying Even income was much higher - 59% higher in 2015 for someone who began work in 1975. If you received a wage increase equal to the CPI or a Cost of Living index every year, you would find yourself very far behind over the course of just three decades.
Why is this? Simply put, this is because the US economy grows faster than inflation and population growth – it generates real wealth over time. If your increase in wealth merely tracks inflation, you will find yourself increasingly poorer relative to those around you. This is important! Raises based upon COLA or the CPI will not be sufficient for you to Stay Even – use the Staying Even Index to determine which raises will.
An Example
Below is a simple example to help illustrate our approach. This examples follows Charles, who is a teacher living in a very small community.
Year One – Charles Starts His Career: In year one of Charles' teaching career he earns $40 per year. His community has a population of ten people and the total of all income made by its inhabitants is $500. The average income therefore is $50, meaning Charles is making 80% of the average person's salary.
Year Ten – Charles is in Mid-Career: By year ten of Charles’ career, he is earning $60 per year. His income has grown by 50% since Year 1! The population has grown to 12 people and the total of all income has grown to $1,200. The average income has grown to $100, a 100% total increase!
How has Charles Done? While Charles’ income has grown by 50%, the average income has grown by 100%. So even though Charles is earning a significantly higher amount of pay, he has fallen behind those around him. He is likely to feel poorer, not better off, than when he started, although if he looks at only his paycheck he will appear to be doing better. He needs a 33% raise – to $80 a year – just to Stay Even with where he started. That raise would just keep him even – it would not reflect any additional compensation for his ten years of experience and the likelihood that he may be significantly more effective than when he started.
How would this Situation Likely Feel to Charles? In what way is Charles likely to be poorer? The best way we know how to measure wealth is in comparison with others. Charles will likely find it hard to keep up with the spending of others, meaning he may find those around him may be able to afford better vacations than him, nicer meals than him, a nicer car, or a nicer home. While Charles' wage have increased, his buying power has decreased in relation to the average person in his community.
How Does the Staying Even Index Information Help Charles? Charles likely knew instinctively that he was falling behind, but also likely had no numerical way of proving it. With the Staying Even index, he now knows exactly how much he has fallen behind and needs to think through whether this is because his skills are less highly valued than they once were (maybe he should consider a career change), or, if he hasn’t gotten the raises he should, in which case he should think about renegotiating his rate of pay. He now has real information, rather than just a feeling.